Chapter 3 Loading data into R
R can access data files from a wide variety of sources. These include
- Text files (csv, tsv, fixed-width)
- Microsoft Excel files
- Microsoft Access databases
- SQL-based databases (MySql, Postgresql, SQLite, Amazon Redshift)
- Enterprise databases (SAP, Oracle)
The R package rio can help read and write to many file types that are single files,
and the package rodbc can do the same for the databases.
Exercise: Install the R package
rio into your R installation
install.packages("rio", repos = "https://cran.rstudio.com") # Note the quotesThe rio package has a common way of reading data (using the import function).
Importing the data will create an object called a data.frame, but if you
just import data, it is not saved since it doesn’t yet have a name.
library(rio) # activate the package
import('data/HR_Data.csv') # can use single or double quotes
So every time you import data, you have to name it. You do this using the <- operator.
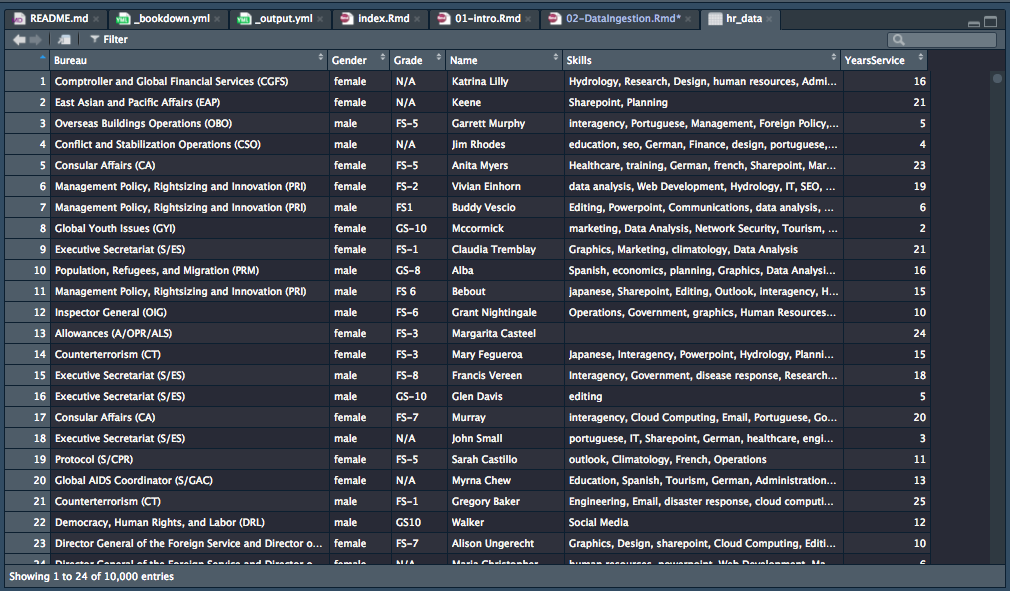
hr_data <- import('data/HR_Data.csv')Now, if you type hr_data in the console, you will see the data you imported.
head(hr_data) # This just displays the first 10 lines of the data## Bureau Gender Grade
## 1 Comptroller and Global Financial Services (CGFS) female N/A
## 2 East Asian and Pacific Affairs (EAP) female N/A
## 3 Overseas Buildings Operations (OBO) male FS-5
## 4 Conflict and Stabilization Operations (CSO) male N/A
## 5 Consular Affairs (CA) female FS-5
## 6 Management Policy, Rightsizing and Innovation (PRI) female FS-2
## Name
## 1 Katrina Lilly
## 2 Keene
## 3 Garrett Murphy
## 4 Jim Rhodes
## 5 Anita Myers
## 6 Vivian Einhorn
## Skills
## 1 Hydrology, Research, Design, human resources, Administration
## 2 Sharepoint, Planning
## 3 interagency, Portuguese, Management, Foreign Policy, Economics, Human Resources
## 4 education, seo, German, Finance, design, portuguese, disease response, Excel
## 5 Healthcare, training, German, french, Sharepoint, Marketing, Data Analysis, Economics, spanish
## 6 data analysis, Web Development, Hydrology, IT, SEO, Disease Response, Japanese
## YearsService
## 1 16
## 2 21
## 3 5
## 4 4
## 5 23
## 6 19Seeing the data like this is certainly a bit awkward, especially for large datasets. In RStudio, you can see the data somewhat like a spreadsheet with the following command:
View(hr_data)This results in a new pane in RStudio.