class: center, middle, inverse, title-slide # Maps and spatial data ### Abhijit Dasgupta, PhD --- layout: true <div class="my-header"> <span>BIOF 339: Practical R</span></div> --- class: middle, inverse, center # Maps --- #### Toolsets Visualizing spatial and geographic data is a specialized area on its own R has increasing capabilities in this regard, and its increasingly mature. Some of the packages that we might need are .pull-left[ #### Data + `sf` + `sp` + `raster` + `spData` + `rnaturalearthdata` ] .pull-right[ #### Visualization + `ggplot` + `ggmap` + `geom_sf` + `tmap` + `leaflet` ] > Several parts of this lecture are inspired by [Chapter 8](https://geocompr.robinlovelace.net/adv-map.html) of Geocomputation with R by Lovelace, Nowosad and Muenchow (2019), also available on [Amazon](https://www.amazon.com/Geocomputation-Chapman-Hall-Robin-Lovelace/dp/1138304514/) --- #### Toolset We'll start of loading the following packages ```r library(ggplot2) library(sf) library(spData) ``` The **sf** package provides [simple features access](https://en.wikipedia.org/wiki/Simple_Features) for R, and helps to store and process geographic data within the tidyverse framework, while linking to several geospatial packages that are standard in the geography world. .pull-left[ <img src="img/sfcartoon.jpg" width="70%" height="70%" /> <div style="font-size:12pt;">Illustration by Allison Horst</div> ] .pull-right[To use **sf** you may need to install some additional software. At the very least you will need to install the R packages **rgdal** and **rgeos**. Additional information is available [here](htps://r-spacial.github.io/sf/) ] --- ## Chloropleth maps Chloropleth maps are maps with some geometries filled in to signify levels of some variable. .pull-left[ <img src="img/Smoking-rates.png" width="968" /> .small[Smoking rates in USA in 2012 (NY Times, March 24, 2014)] ] .pull-right[ <img src="img/Figure-1-1.png" width="120%" height="120%" /> .small[Observed to Expected Ratios (OERs) for Rates of Primary Total Knee Arthroplasty Among White Medicare Beneficiaries by Health Referral Region [(Ward & Dasgupta, 2020)](https://jamanetwork.com/journals/jamanetworkopen/fullarticle/2765054)]] --- ### A chloropleth of life expectancy We'll start off with a world map .left-column70[ ```r library(sf); library(spData) ggplot(data = world) + geom_sf() # a special geometry for plotting maps ``` 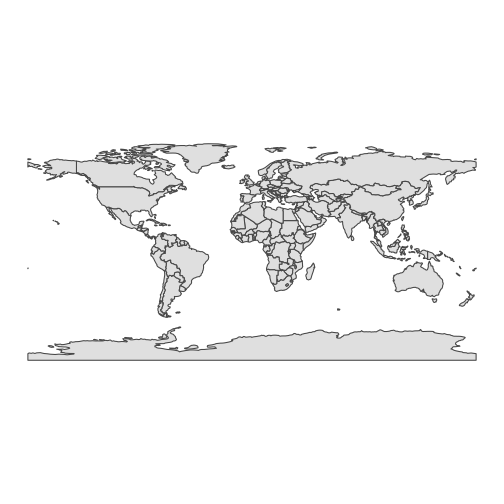<!-- --> ] .right-column70[ There are several ways of getting map geometries, which are specifications of polygons. If you look at `world`, you'll see it's a data.frame, with one column named `geometry`. This column provides the shapes of the polygons, and what `geom_sf` looks for ] --- ### A chloropleth of life expectancy If you look at `world`, it also provides life expectancy estimates from 2014 (World Bank). The data set is tidy, with one row corresponding to one country. We'll use our known **ggplot2** way of filling things in. .left-column70[ ```r ggplot(data = spData::world) + geom_sf(aes(fill = lifeExp)) # a special geometry for plotting maps ``` 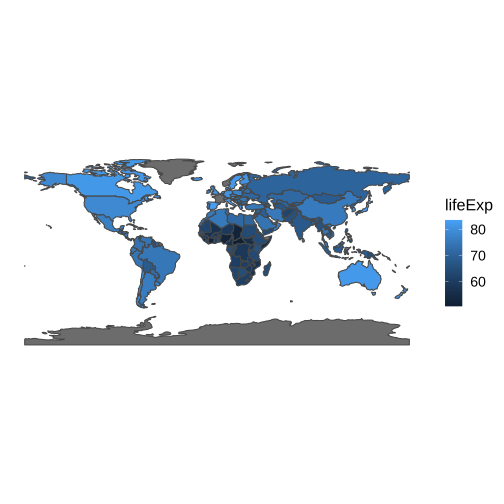<!-- --> ] .right-column70[ We need a more distinctive color palette. ] --- ### A chloropleth of life expectancy If you look at `world`, it also provides life expectancy estimates from 2014 (World Bank). The data set is tidy, with one row corresponding to one country. We'll use our known **ggplot2** way of filling things in. ```r ggplot(data = spData::world) + geom_sf(aes(fill = lifeExp)) + # a special geometry for plotting maps viridis::scale_fill_viridis('Life Exp', option='plasma', trans='sqrt', labels = scales::label_number_si()) ``` <img src="07-maps_files/figure-html/unnamed-chunk-6-1.png" width="60%" height="60%" /> --- ## The electoral picture in Florida, 2000 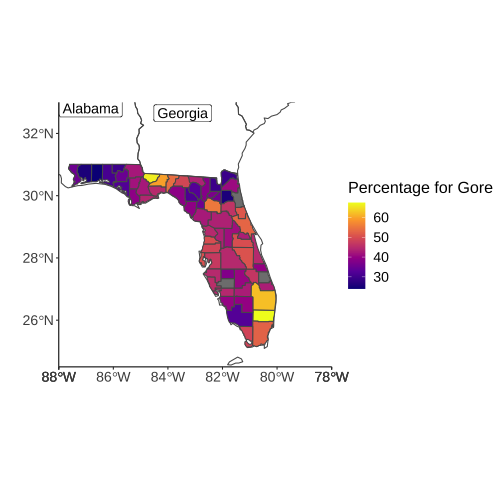<!-- --> We'll develop this map in a tutorial --- class: middle, center ## Using tmap --- ## Using tmap The **tmap** package uses many synactical structures similar to **ggplot2**, but can be nicer in some ways .left-column70[ ```r library(tmap) tm_shape(spData::world) + tm_polygons(col = "lifeExp", style='jenks', title = 'Life expectancy') ``` 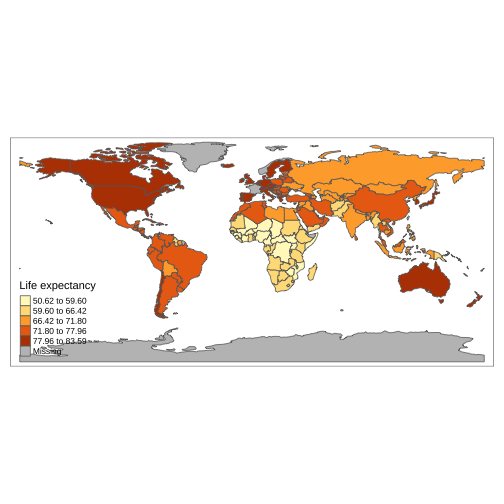<!-- --> ] .right-column70[ It's more "publication-ready" by default It makes some nice choices ] --- ## tmap (interactive) ```r *tmap_mode('view') tm <- tm_shape(spData::world) + tm_polygons(col = 'pop', style='jenks', palette='Reds', title='Population', popup.vars = c('pop'), id='name_long') ``` <iframe src="img/map_tmap.html" width='1200' height='500' scrolling='no' seamless='seamless' frameBorder='0'></iframe> --- ## Street maps The easiest ways to overlay data on street maps is with the **leaflet** package. ```r library(leaflet) library(leaflet.providers) load(file.path(here::here('slides','lectures','data', 'exdata.rda'))) leaflet(gpx) %>% addTiles() %>% addCircleMarkers(~Longitude, ~Latitude, radius=1) ``` <iframe src="img/map1.html" width='1200' height='500' scrolling='no' seamless='seamless' frameBorder='0'></iframe> --- ## Street maps You can also use the **mapview** package, which calls **leaflet** and has a bit more compact syntax .pull-left[ ```r load(file.path(here::here('slides','lectures','data', 'exdata.rda'))) gpx <- sf::st_as_sf(gpx, coords=c("Longitude", "Latitude"), crs = 4267) # Need to make sf object mapview::mapview(gpx, color='blue', map.type = 'OpenStreetMap.Mapnik', cex = 0.2, # size of points legend=FALSE) ``` ] .pull-right[ <img src="img/run.png" width="1323" /> ] --- ## Street maps You can also use the **mapview** package, which calls **leaflet** and has a bit more compact syntax .pull-left[ ```r load(file.path(here::here('slides','lectures','data', 'exdata.rda'))) gpx <- st_as_sf(gpx, coords=c("Longitude", "Latitude"), crs = 4267) # Need to make sf object mapview::mapview(gpx, color='blue', * map.type = 'Stamen.Watercolor', cex = 0.2, # size of points legend=FALSE) ``` You can also have some stylistic fun with maps. More possibilities at [http://leaflet-extras.github.io/leaflet-providers/preview/](http://leaflet-extras.github.io/leaflet-providers/preview/) ] .pull-right[ <img src="img/run2.png" width="1323" /> ] --- ## Dot density maps .pull-left[ ```r library(ggmap) crime1 <- crime %>% filter(between(crime$lon, -95.4, -95.34) & between(crime$lat, 29.746, 29.784)) qmplot(lon, lat, data=crime1, maptype='toner-lite', color = I('red')) ``` <!-- --> ] .pull-right[ **ggmap** was built for Google Maps Google Maps requires a credit card now Better option is Stamen Maps, which uses OpenStreetMap data ] --- ## Dot density maps .pull-left[  ] .pull-right[ Code is available [here](./dot_density.R) Based on [this blog](https://tarakc02.github.io/dot-density/) by Tarak Shah ] --- ## Facetted maps .pull-left[ ```r library(ggmap) crime1 <- crime1 %>% filter(!(offense %in% c('auto theft','theft', 'burglary'))) qmplot(lon, lat, data=crime1, maptype='toner-background', color = offense)+ facet_wrap(~offense) ``` ] .pull-right[ <!-- --> ] --- ## Facetted maps .pull-left[ ```r library(tmap) world1 <- world %>% filter(continent %in% c('Europe','Asia', 'North America', 'South America')) %>% mutate(continent = fct_reorder(continent, lifeExp, na.rm=T)) tm_shape(world1)+tm_polygons(col='lifeExp') + tm_facets(by='continent', ncol=2) ``` ] .pull-right[ <img src="img/tmap_facet.png" width="100%" height="100%" /> ]