class: center, middle, inverse, title-slide # Visualizing the nature of data sets ### Abhijit Dasgupta, PhD --- layout: true <div class="my-header"> <span>BIOF 339: Practical R</span></div> --- class: middle, center # The nature of a data set --- ## Data characteristics Some of the things we care about in a data set are + Nature of each column + Missing data patterns + Correlation patterns The **visdat** package and the **naniar** package help us with visualizing these. --- ## Without visualization .pull-left[ ```r summary(airquality) ``` ``` Ozone Solar.R Wind Temp Min. : 1.00 Min. : 7.0 Min. : 1.700 Min. :56.00 1st Qu.: 18.00 1st Qu.:115.8 1st Qu.: 7.400 1st Qu.:72.00 Median : 31.50 Median :205.0 Median : 9.700 Median :79.00 Mean : 42.13 Mean :185.9 Mean : 9.958 Mean :77.88 3rd Qu.: 63.25 3rd Qu.:258.8 3rd Qu.:11.500 3rd Qu.:85.00 Max. :168.00 Max. :334.0 Max. :20.700 Max. :97.00 NA's :37 NA's :7 Month Day Min. :5.000 Min. : 1.0 1st Qu.:6.000 1st Qu.: 8.0 Median :7.000 Median :16.0 Mean :6.993 Mean :15.8 3rd Qu.:8.000 3rd Qu.:23.0 Max. :9.000 Max. :31.0 ``` ] .pull-right[ ```r glimpse(airquality, width=40) ``` ``` Rows: 153 Columns: 6 $ Ozone <int> 41, 36, 12, 18, NA, 28… $ Solar.R <int> 190, 118, 149, 313, NA… $ Wind <dbl> 7.4, 8.0, 12.6, 11.5, … $ Temp <int> 67, 72, 74, 62, 56, 66… $ Month <int> 5, 5, 5, 5, 5, 5, 5, 5… $ Day <int> 1, 2, 3, 4, 5, 6, 7, 8… ``` ] These give us a variable-by-variable view. --- ## Visualizing a dataset .pull-left[ ```r visdat::vis_dat(airquality) ``` <!-- --> ] .pull-right[ + What kinds of variables are in the dataset + Which elements are missing + A sense of missing patterns ] --- ## Correlation patterns ```r visdat::vis_cor(airquality) ``` <!-- --> --- ## Focus on missing data patterns ```r visdat::vis_miss(airquality) ``` <!-- --> --- class: middle, center # A deeper look at missing data --- ```r library(naniar) gg_miss_upset(airquality) ``` <!-- --> --- ```r gg_miss_upset(riskfactors) ``` 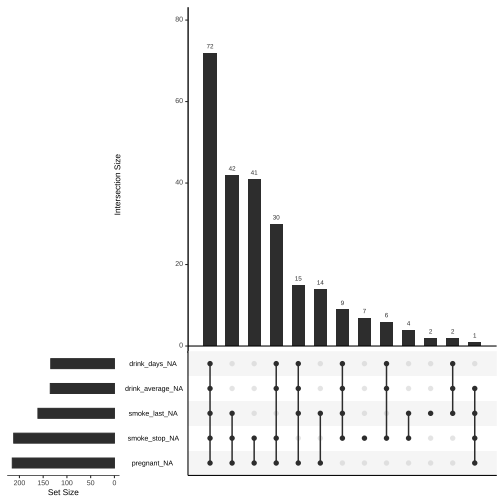<!-- --> --- ## Missing at random? Does missingness in one variable depend on values of another variable? .pull-left[ ```r ggplot(airquality, aes(Ozone, Solar.R))+ geom_miss_point() ``` 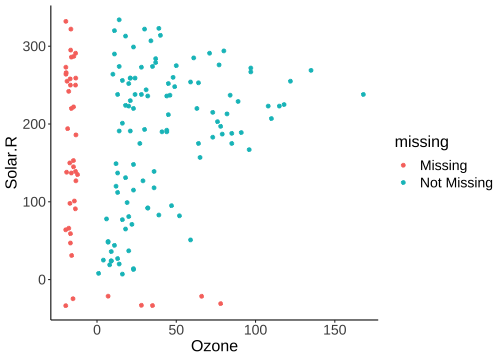<!-- --> ] .pull-right[ The red points are the values of one variable when the other variable is missing ] --- ## Missing at random? .pull-left[ ```r gg_miss_fct(x = riskfactors, fct=marital) ``` 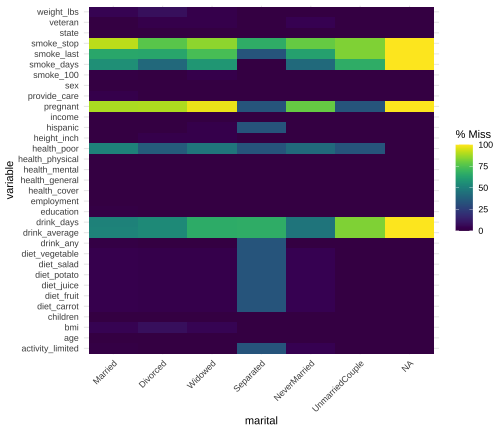<!-- --> ] .pull-right[ Percent missing in each variable by levels of a factor What you're looking for is relatively even colors across ] --- ## Further exploration 1. The **naniar** [website](http://naniar.njtierney.com/)