class: center, middle, inverse, title-slide # Why data visualization? ### Abhijit Dasgupta ### BIOF 339 --- layout: true <div class="my-header"> <span>BIOF 339: Practical R</span> </div> ## The failed promise of data summaries --- It is tempting to try and summarize data just by some data summaries, like means, medians or standard deviations. Summaries, by their very nature, compress information Which means .heatinline[some information gets thrown out] -- Visualization gives us a way to see patterns in the data that would not be obvious from data summaries It also allows us to use our natural visual ability of pattern recognition to understand our data --- ### Anscombe's data .pull-left[ <!-- --> ] .pull-right[ | Statistic | Value | |:----------|------:| | `mean(x)` | 9 | | `mean(y)` | 7.5 | | `var(x)` | 11 | | `var(y)` | 4.13 | | `cor(x,y)` | 0.82 | The variables for each data set have the same values of data summaries ] --- ### The [DataSaurus](https://www.autodeskresearch.com/publications/samestats) dozen .pull-left[ <!-- --> ] .pull-right[ | Statistic | Value | |:----------|------:| | `mean(x)` | 54.3 | | `mean(y)` | 47.8 | | `var(x)` | 281 | | `var(y)` | 725 | | `cor(x,y)` | -0.07 | The variables for each data set have the same values of data summaries ] --- .left-column30[ A single point can completely change the computed correlation ] .right-column70[  ] --- Data summaries are meant to help distinguish between different data sets Both Anscombe and Datasaurus show that this promise is not met by standard data summaries The previous example shows how a single point can change data summaries --- layout: true <div class="my-header"> <span>BIOF 339: Practical R</span></div> --- ## Why visualize data? - Summary statistics cannot always distinguish datasets - Take advantage of humans' ability to visually recognize and remember patterns - Find discrepancies in the data more easily --- class: middle, center # Some examples --- layout: true <div class="my-header"> <span>BIOF 339: Practical R</span> </div> ## Gallery --- <img src="01-why_plot_files/figure-html/05-Plotting-7-1.png" style="display: block; margin: auto;" /> ??? This is a typical plot in scientific journals --- ### Kaplan-Meier plots <!-- --> --- <img src="01-why_plot_files/figure-html/05-Plotting-8-1.png" style="display: block; margin: auto;" /> ??? We can put ggplot figures together in a panel with some annotations very easily using the cowplot package. These graphs can be cleaned up some. --- <img src="01-why_plot_files/figure-html/05-Plotting-9-1.png" style="display: block; margin: auto;" /> ??? This is a plot of the diamonds dataset that comes with ggplot2 --- ### Manhattan plot <img src="01-why_plot_files/figure-html/05-Plotting-10-1.png" width="600px" height="500px" style="display: block; margin: auto;" /> ??? Manhattan plots are often used in GWAS studies. You can customize the annotations and the line for the significance levels --- ### Circular Manhattan plot <img src="/Users/abhijit/ARAASTAT/Teaching/BIOF339/slides/lectures/week3/img/Circular-Manhattan.trait1.trait2.trait3.jpg" width="500" height="500" /> ??? This gives a different representation of the manhattan plot. This example looks at three traits simultaneously --- ### Maps .pull-left[ <iframe src="img/map2.html" width="1200" height="500" scrolling="no" seamless="seamless" frameBorder="0"> </iframe> ] .pull-right[ <iframe src="img/map1.html" width="1200" height="500" scrolling="no" seamless="seamless" frameBorder="0"> </iframe> ] --- ### Heatmap .pull-left[ <!-- --> ] .pull-right[ <!-- --> ] --- ### OncoPrint 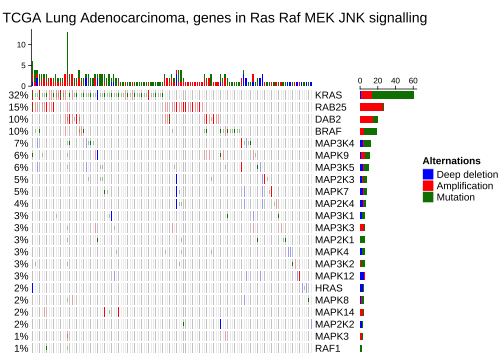<!-- --> --- ### Interactive graphs <div id="htmlwidget-cdc64c4765cae9104636" style="width:504px;height:504px;" class="plotly html-widget"></div> <script type="application/json" data-for="htmlwidget-cdc64c4765cae9104636">{"x":{"data":[{"x":[5.1,4.9,4.7,4.6,5,5.4,4.6,5,4.4,4.9,5.4,4.8,4.8,4.3,5.8,5.7,5.4,5.1,5.7,5.1,5.4,5.1,4.6,5.1,4.8,5,5,5.2,5.2,4.7,4.8,5.4,5.2,5.5,4.9,5,5.5,4.9,4.4,5.1,5,4.5,4.4,5,5.1,4.8,5.1,4.6,5.3,5],"y":[3.5,3,3.2,3.1,3.6,3.9,3.4,3.4,2.9,3.1,3.7,3.4,3,3,4,4.4,3.9,3.5,3.8,3.8,3.4,3.7,3.6,3.3,3.4,3,3.4,3.5,3.4,3.2,3.1,3.4,4.1,4.2,3.1,3.2,3.5,3.6,3,3.4,3.5,2.3,3.2,3.5,3.8,3,3.8,3.2,3.7,3.3],"text":["Sepal Length = 5.1<br />Sepal Width = 3.5<br />Row Number: 1","Sepal Length = 4.9<br />Sepal Width = 3<br />Row Number: 2","Sepal Length = 4.7<br />Sepal Width = 3.2<br />Row Number: 3","Sepal Length = 4.6<br />Sepal Width = 3.1<br />Row Number: 4","Sepal Length = 5<br />Sepal Width = 3.6<br />Row Number: 5","Sepal Length = 5.4<br />Sepal Width = 3.9<br />Row Number: 6","Sepal Length = 4.6<br />Sepal Width = 3.4<br />Row Number: 7","Sepal Length = 5<br />Sepal Width = 3.4<br />Row Number: 8","Sepal Length = 4.4<br />Sepal Width = 2.9<br />Row Number: 9","Sepal Length = 4.9<br />Sepal Width = 3.1<br />Row Number: 10","Sepal Length = 5.4<br />Sepal Width = 3.7<br />Row Number: 11","Sepal Length = 4.8<br />Sepal Width = 3.4<br />Row Number: 12","Sepal Length = 4.8<br />Sepal Width = 3<br />Row Number: 13","Sepal Length = 4.3<br />Sepal Width = 3<br />Row Number: 14","Sepal Length = 5.8<br />Sepal Width = 4<br />Row Number: 15","Sepal Length = 5.7<br />Sepal Width = 4.4<br />Row Number: 16","Sepal Length = 5.4<br />Sepal Width = 3.9<br />Row Number: 17","Sepal Length = 5.1<br />Sepal Width = 3.5<br />Row Number: 18","Sepal Length = 5.7<br />Sepal Width = 3.8<br />Row Number: 19","Sepal Length = 5.1<br />Sepal Width = 3.8<br />Row Number: 20","Sepal Length = 5.4<br />Sepal Width = 3.4<br />Row Number: 21","Sepal Length = 5.1<br />Sepal Width = 3.7<br />Row Number: 22","Sepal Length = 4.6<br />Sepal Width = 3.6<br />Row Number: 23","Sepal Length = 5.1<br />Sepal Width = 3.3<br />Row Number: 24","Sepal Length = 4.8<br />Sepal Width = 3.4<br />Row Number: 25","Sepal Length = 5<br />Sepal Width = 3<br />Row Number: 26","Sepal Length = 5<br />Sepal Width = 3.4<br />Row Number: 27","Sepal Length = 5.2<br />Sepal Width = 3.5<br />Row Number: 28","Sepal Length = 5.2<br />Sepal Width = 3.4<br />Row Number: 29","Sepal Length = 4.7<br />Sepal Width = 3.2<br />Row Number: 30","Sepal Length = 4.8<br />Sepal Width = 3.1<br />Row Number: 31","Sepal Length = 5.4<br />Sepal Width = 3.4<br />Row Number: 32","Sepal Length = 5.2<br />Sepal Width = 4.1<br />Row Number: 33","Sepal Length = 5.5<br />Sepal Width = 4.2<br />Row Number: 34","Sepal Length = 4.9<br />Sepal Width = 3.1<br />Row Number: 35","Sepal Length = 5<br />Sepal Width = 3.2<br />Row Number: 36","Sepal Length = 5.5<br />Sepal Width = 3.5<br />Row Number: 37","Sepal Length = 4.9<br />Sepal Width = 3.6<br />Row Number: 38","Sepal Length = 4.4<br />Sepal Width = 3<br />Row Number: 39","Sepal Length = 5.1<br />Sepal Width = 3.4<br />Row Number: 40","Sepal Length = 5<br />Sepal Width = 3.5<br />Row Number: 41","Sepal Length = 4.5<br />Sepal Width = 2.3<br />Row Number: 42","Sepal Length = 4.4<br />Sepal Width = 3.2<br />Row Number: 43","Sepal Length = 5<br />Sepal Width = 3.5<br />Row Number: 44","Sepal Length = 5.1<br />Sepal Width = 3.8<br />Row Number: 45","Sepal Length = 4.8<br />Sepal Width = 3<br />Row Number: 46","Sepal Length = 5.1<br />Sepal Width = 3.8<br />Row Number: 47","Sepal Length = 4.6<br />Sepal Width = 3.2<br />Row Number: 48","Sepal Length = 5.3<br />Sepal Width = 3.7<br />Row Number: 49","Sepal Length = 5<br />Sepal Width = 3.3<br />Row Number: 50","Sepal Length = 7<br />Sepal Width = 3.2<br />Row Number: 51","Sepal Length = 6.4<br />Sepal Width = 3.2<br />Row Number: 52","Sepal Length = 6.9<br />Sepal Width = 3.1<br />Row Number: 53","Sepal Length = 5.5<br />Sepal Width = 2.3<br />Row Number: 54","Sepal Length = 6.5<br />Sepal Width = 2.8<br />Row Number: 55","Sepal Length = 5.7<br />Sepal Width = 2.8<br />Row Number: 56","Sepal Length = 6.3<br />Sepal Width = 3.3<br />Row Number: 57","Sepal Length = 4.9<br />Sepal Width = 2.4<br />Row Number: 58","Sepal Length = 6.6<br />Sepal Width = 2.9<br />Row Number: 59","Sepal Length = 5.2<br />Sepal Width = 2.7<br />Row Number: 60","Sepal Length = 5<br />Sepal Width = 2<br />Row Number: 61","Sepal Length = 5.9<br />Sepal Width = 3<br />Row Number: 62","Sepal Length = 6<br />Sepal Width = 2.2<br />Row Number: 63","Sepal Length = 6.1<br />Sepal Width = 2.9<br />Row Number: 64","Sepal Length = 5.6<br />Sepal Width = 2.9<br />Row Number: 65","Sepal Length = 6.7<br />Sepal Width = 3.1<br />Row Number: 66","Sepal Length = 5.6<br />Sepal Width = 3<br />Row Number: 67","Sepal Length = 5.8<br />Sepal Width = 2.7<br />Row Number: 68","Sepal Length = 6.2<br />Sepal Width = 2.2<br />Row Number: 69","Sepal Length = 5.6<br />Sepal Width = 2.5<br />Row Number: 70","Sepal Length = 5.9<br />Sepal Width = 3.2<br />Row Number: 71","Sepal Length = 6.1<br />Sepal Width = 2.8<br />Row Number: 72","Sepal Length = 6.3<br />Sepal Width = 2.5<br />Row Number: 73","Sepal Length = 6.1<br />Sepal Width = 2.8<br />Row Number: 74","Sepal Length = 6.4<br />Sepal Width = 2.9<br />Row Number: 75","Sepal Length = 6.6<br />Sepal Width = 3<br />Row Number: 76","Sepal Length = 6.8<br />Sepal Width = 2.8<br />Row Number: 77","Sepal Length = 6.7<br />Sepal Width = 3<br />Row Number: 78","Sepal Length = 6<br />Sepal Width = 2.9<br />Row Number: 79","Sepal Length = 5.7<br />Sepal Width = 2.6<br />Row Number: 80","Sepal Length = 5.5<br />Sepal Width = 2.4<br />Row Number: 81","Sepal Length = 5.5<br />Sepal Width = 2.4<br />Row Number: 82","Sepal Length = 5.8<br />Sepal Width = 2.7<br />Row Number: 83","Sepal Length = 6<br />Sepal Width = 2.7<br />Row Number: 84","Sepal Length = 5.4<br />Sepal Width = 3<br />Row Number: 85","Sepal Length = 6<br />Sepal Width = 3.4<br />Row Number: 86","Sepal Length = 6.7<br />Sepal Width = 3.1<br />Row Number: 87","Sepal Length = 6.3<br />Sepal Width = 2.3<br />Row Number: 88","Sepal Length = 5.6<br />Sepal Width = 3<br />Row Number: 89","Sepal Length = 5.5<br />Sepal Width = 2.5<br />Row Number: 90","Sepal Length = 5.5<br />Sepal Width = 2.6<br />Row Number: 91","Sepal Length = 6.1<br />Sepal Width = 3<br />Row Number: 92","Sepal Length = 5.8<br />Sepal Width = 2.6<br />Row Number: 93","Sepal Length = 5<br />Sepal Width = 2.3<br />Row Number: 94","Sepal Length = 5.6<br />Sepal Width = 2.7<br />Row Number: 95","Sepal Length = 5.7<br />Sepal Width = 3<br />Row Number: 96","Sepal Length = 5.7<br />Sepal Width = 2.9<br />Row Number: 97","Sepal Length = 6.2<br />Sepal Width = 2.9<br />Row Number: 98","Sepal Length = 5.1<br />Sepal Width = 2.5<br />Row Number: 99","Sepal Length = 5.7<br />Sepal Width = 2.8<br />Row Number: 100","Sepal Length = 6.3<br />Sepal Width = 3.3<br />Row Number: 101","Sepal Length = 5.8<br />Sepal Width = 2.7<br />Row Number: 102","Sepal Length = 7.1<br />Sepal Width = 3<br />Row Number: 103","Sepal Length = 6.3<br />Sepal Width = 2.9<br />Row Number: 104","Sepal Length = 6.5<br />Sepal Width = 3<br />Row Number: 105","Sepal Length = 7.6<br />Sepal Width = 3<br />Row Number: 106","Sepal Length = 4.9<br />Sepal Width = 2.5<br />Row Number: 107","Sepal Length = 7.3<br />Sepal Width = 2.9<br />Row Number: 108","Sepal Length = 6.7<br />Sepal Width = 2.5<br />Row Number: 109","Sepal Length = 7.2<br />Sepal Width = 3.6<br />Row Number: 110","Sepal Length = 6.5<br />Sepal Width = 3.2<br />Row Number: 111","Sepal Length = 6.4<br />Sepal Width = 2.7<br />Row Number: 112","Sepal Length = 6.8<br />Sepal Width = 3<br />Row Number: 113","Sepal Length = 5.7<br />Sepal Width = 2.5<br />Row Number: 114","Sepal Length = 5.8<br />Sepal Width = 2.8<br />Row Number: 115","Sepal Length = 6.4<br />Sepal Width = 3.2<br />Row Number: 116","Sepal Length = 6.5<br />Sepal Width = 3<br />Row Number: 117","Sepal Length = 7.7<br />Sepal Width = 3.8<br />Row Number: 118","Sepal Length = 7.7<br />Sepal Width = 2.6<br />Row Number: 119","Sepal Length = 6<br />Sepal Width = 2.2<br />Row Number: 120","Sepal Length = 6.9<br />Sepal Width = 3.2<br />Row Number: 121","Sepal Length = 5.6<br />Sepal Width = 2.8<br />Row Number: 122","Sepal Length = 7.7<br />Sepal Width = 2.8<br />Row Number: 123","Sepal Length = 6.3<br />Sepal Width = 2.7<br />Row Number: 124","Sepal Length = 6.7<br />Sepal Width = 3.3<br />Row Number: 125","Sepal Length = 7.2<br />Sepal Width = 3.2<br />Row Number: 126","Sepal Length = 6.2<br />Sepal Width = 2.8<br />Row Number: 127","Sepal Length = 6.1<br />Sepal Width = 3<br />Row Number: 128","Sepal Length = 6.4<br />Sepal Width = 2.8<br />Row Number: 129","Sepal Length = 7.2<br />Sepal Width = 3<br />Row Number: 130","Sepal Length = 7.4<br />Sepal Width = 2.8<br />Row Number: 131","Sepal Length = 7.9<br />Sepal Width = 3.8<br />Row Number: 132","Sepal Length = 6.4<br />Sepal Width = 2.8<br />Row Number: 133","Sepal Length = 6.3<br />Sepal Width = 2.8<br />Row Number: 134","Sepal Length = 6.1<br />Sepal Width = 2.6<br />Row Number: 135","Sepal Length = 7.7<br />Sepal Width = 3<br />Row Number: 136","Sepal Length = 6.3<br />Sepal Width = 3.4<br />Row Number: 137","Sepal Length = 6.4<br />Sepal Width = 3.1<br />Row Number: 138","Sepal Length = 6<br />Sepal Width = 3<br />Row Number: 139","Sepal Length = 6.9<br />Sepal Width = 3.1<br />Row Number: 140","Sepal Length = 6.7<br />Sepal Width = 3.1<br />Row Number: 141","Sepal Length = 6.9<br />Sepal Width = 3.1<br />Row Number: 142","Sepal Length = 5.8<br />Sepal Width = 2.7<br />Row Number: 143","Sepal Length = 6.8<br />Sepal Width = 3.2<br />Row Number: 144","Sepal Length = 6.7<br />Sepal Width = 3.3<br />Row Number: 145","Sepal Length = 6.7<br />Sepal Width = 3<br />Row Number: 146","Sepal Length = 6.3<br />Sepal Width = 2.5<br />Row Number: 147","Sepal Length = 6.5<br />Sepal Width = 3<br />Row Number: 148","Sepal Length = 6.2<br />Sepal Width = 3.4<br />Row Number: 149","Sepal Length = 5.9<br />Sepal Width = 3<br />Row Number: 150"],"type":"scatter","mode":"markers","marker":{"autocolorscale":false,"color":"rgba(248,118,109,1)","opacity":0.6,"size":7.55905511811024,"symbol":"circle","line":{"width":1.88976377952756,"color":"rgba(248,118,109,1)"}},"hoveron":"points","name":"setosa","legendgroup":"setosa","showlegend":true,"xaxis":"x","yaxis":"y","hoverinfo":"text","frame":null},{"x":[7,6.4,6.9,5.5,6.5,5.7,6.3,4.9,6.6,5.2,5,5.9,6,6.1,5.6,6.7,5.6,5.8,6.2,5.6,5.9,6.1,6.3,6.1,6.4,6.6,6.8,6.7,6,5.7,5.5,5.5,5.8,6,5.4,6,6.7,6.3,5.6,5.5,5.5,6.1,5.8,5,5.6,5.7,5.7,6.2,5.1,5.7],"y":[3.2,3.2,3.1,2.3,2.8,2.8,3.3,2.4,2.9,2.7,2,3,2.2,2.9,2.9,3.1,3,2.7,2.2,2.5,3.2,2.8,2.5,2.8,2.9,3,2.8,3,2.9,2.6,2.4,2.4,2.7,2.7,3,3.4,3.1,2.3,3,2.5,2.6,3,2.6,2.3,2.7,3,2.9,2.9,2.5,2.8],"text":["Sepal Length = 5.1<br />Sepal Width = 3.5<br />Row Number: 1","Sepal Length = 4.9<br />Sepal Width = 3<br />Row Number: 2","Sepal Length = 4.7<br />Sepal Width = 3.2<br />Row Number: 3","Sepal Length = 4.6<br />Sepal Width = 3.1<br />Row Number: 4","Sepal Length = 5<br />Sepal Width = 3.6<br />Row Number: 5","Sepal Length = 5.4<br />Sepal Width = 3.9<br />Row Number: 6","Sepal Length = 4.6<br />Sepal Width = 3.4<br />Row Number: 7","Sepal Length = 5<br />Sepal Width = 3.4<br />Row Number: 8","Sepal Length = 4.4<br />Sepal Width = 2.9<br />Row Number: 9","Sepal Length = 4.9<br />Sepal Width = 3.1<br />Row Number: 10","Sepal Length = 5.4<br />Sepal Width = 3.7<br />Row Number: 11","Sepal Length = 4.8<br />Sepal Width = 3.4<br />Row Number: 12","Sepal Length = 4.8<br />Sepal Width = 3<br />Row Number: 13","Sepal Length = 4.3<br />Sepal Width = 3<br />Row Number: 14","Sepal Length = 5.8<br />Sepal Width = 4<br />Row Number: 15","Sepal Length = 5.7<br />Sepal Width = 4.4<br />Row Number: 16","Sepal Length = 5.4<br />Sepal Width = 3.9<br />Row Number: 17","Sepal Length = 5.1<br />Sepal Width = 3.5<br />Row Number: 18","Sepal Length = 5.7<br />Sepal Width = 3.8<br />Row Number: 19","Sepal Length = 5.1<br />Sepal Width = 3.8<br />Row Number: 20","Sepal Length = 5.4<br />Sepal Width = 3.4<br />Row Number: 21","Sepal Length = 5.1<br />Sepal Width = 3.7<br />Row Number: 22","Sepal Length = 4.6<br />Sepal Width = 3.6<br />Row Number: 23","Sepal Length = 5.1<br />Sepal Width = 3.3<br />Row Number: 24","Sepal Length = 4.8<br />Sepal Width = 3.4<br />Row Number: 25","Sepal Length = 5<br />Sepal Width = 3<br />Row Number: 26","Sepal Length = 5<br />Sepal Width = 3.4<br />Row Number: 27","Sepal Length = 5.2<br />Sepal Width = 3.5<br />Row Number: 28","Sepal Length = 5.2<br />Sepal Width = 3.4<br />Row Number: 29","Sepal Length = 4.7<br />Sepal Width = 3.2<br />Row Number: 30","Sepal Length = 4.8<br />Sepal Width = 3.1<br />Row Number: 31","Sepal Length = 5.4<br />Sepal Width = 3.4<br />Row Number: 32","Sepal Length = 5.2<br />Sepal Width = 4.1<br />Row Number: 33","Sepal Length = 5.5<br />Sepal Width = 4.2<br />Row Number: 34","Sepal Length = 4.9<br />Sepal Width = 3.1<br />Row Number: 35","Sepal Length = 5<br />Sepal Width = 3.2<br />Row Number: 36","Sepal Length = 5.5<br />Sepal Width = 3.5<br />Row Number: 37","Sepal Length = 4.9<br />Sepal Width = 3.6<br />Row Number: 38","Sepal Length = 4.4<br />Sepal Width = 3<br />Row Number: 39","Sepal Length = 5.1<br />Sepal Width = 3.4<br />Row Number: 40","Sepal Length = 5<br />Sepal Width = 3.5<br />Row Number: 41","Sepal Length = 4.5<br />Sepal Width = 2.3<br />Row Number: 42","Sepal Length = 4.4<br />Sepal Width = 3.2<br />Row Number: 43","Sepal Length = 5<br />Sepal Width = 3.5<br />Row Number: 44","Sepal Length = 5.1<br />Sepal Width = 3.8<br />Row Number: 45","Sepal Length = 4.8<br />Sepal Width = 3<br />Row Number: 46","Sepal Length = 5.1<br />Sepal Width = 3.8<br />Row Number: 47","Sepal Length = 4.6<br />Sepal Width = 3.2<br />Row Number: 48","Sepal Length = 5.3<br />Sepal Width = 3.7<br />Row Number: 49","Sepal Length = 5<br />Sepal Width = 3.3<br />Row Number: 50","Sepal Length = 7<br />Sepal Width = 3.2<br />Row Number: 51","Sepal Length = 6.4<br />Sepal Width = 3.2<br />Row Number: 52","Sepal Length = 6.9<br />Sepal Width = 3.1<br />Row Number: 53","Sepal Length = 5.5<br />Sepal Width = 2.3<br />Row Number: 54","Sepal Length = 6.5<br />Sepal Width = 2.8<br />Row Number: 55","Sepal Length = 5.7<br />Sepal Width = 2.8<br />Row Number: 56","Sepal Length = 6.3<br />Sepal Width = 3.3<br />Row Number: 57","Sepal Length = 4.9<br />Sepal Width = 2.4<br />Row Number: 58","Sepal Length = 6.6<br />Sepal Width = 2.9<br />Row Number: 59","Sepal Length = 5.2<br />Sepal Width = 2.7<br />Row Number: 60","Sepal Length = 5<br />Sepal Width = 2<br />Row Number: 61","Sepal Length = 5.9<br />Sepal Width = 3<br />Row Number: 62","Sepal Length = 6<br />Sepal Width = 2.2<br />Row Number: 63","Sepal Length = 6.1<br />Sepal Width = 2.9<br />Row Number: 64","Sepal Length = 5.6<br />Sepal Width = 2.9<br />Row Number: 65","Sepal Length = 6.7<br />Sepal Width = 3.1<br />Row Number: 66","Sepal Length = 5.6<br />Sepal Width = 3<br />Row Number: 67","Sepal Length = 5.8<br />Sepal Width = 2.7<br />Row Number: 68","Sepal Length = 6.2<br />Sepal Width = 2.2<br />Row Number: 69","Sepal Length = 5.6<br />Sepal Width = 2.5<br />Row Number: 70","Sepal Length = 5.9<br />Sepal Width = 3.2<br />Row Number: 71","Sepal Length = 6.1<br />Sepal Width = 2.8<br />Row Number: 72","Sepal Length = 6.3<br />Sepal Width = 2.5<br />Row Number: 73","Sepal Length = 6.1<br />Sepal Width = 2.8<br />Row Number: 74","Sepal Length = 6.4<br />Sepal Width = 2.9<br />Row Number: 75","Sepal Length = 6.6<br />Sepal Width = 3<br />Row Number: 76","Sepal Length = 6.8<br />Sepal Width = 2.8<br />Row Number: 77","Sepal Length = 6.7<br />Sepal Width = 3<br />Row Number: 78","Sepal Length = 6<br />Sepal Width = 2.9<br />Row Number: 79","Sepal Length = 5.7<br />Sepal Width = 2.6<br />Row Number: 80","Sepal Length = 5.5<br />Sepal Width = 2.4<br />Row Number: 81","Sepal Length = 5.5<br />Sepal Width = 2.4<br />Row Number: 82","Sepal Length = 5.8<br />Sepal Width = 2.7<br />Row Number: 83","Sepal Length = 6<br />Sepal Width = 2.7<br />Row Number: 84","Sepal Length = 5.4<br />Sepal Width = 3<br />Row Number: 85","Sepal Length = 6<br />Sepal Width = 3.4<br />Row Number: 86","Sepal Length = 6.7<br />Sepal Width = 3.1<br />Row Number: 87","Sepal Length = 6.3<br />Sepal Width = 2.3<br />Row Number: 88","Sepal Length = 5.6<br />Sepal Width = 3<br />Row Number: 89","Sepal Length = 5.5<br />Sepal Width = 2.5<br />Row Number: 90","Sepal Length = 5.5<br />Sepal Width = 2.6<br />Row Number: 91","Sepal Length = 6.1<br />Sepal Width = 3<br />Row Number: 92","Sepal Length = 5.8<br />Sepal Width = 2.6<br />Row Number: 93","Sepal Length = 5<br />Sepal Width = 2.3<br />Row Number: 94","Sepal Length = 5.6<br />Sepal Width = 2.7<br />Row Number: 95","Sepal Length = 5.7<br />Sepal Width = 3<br />Row Number: 96","Sepal Length = 5.7<br />Sepal Width = 2.9<br />Row Number: 97","Sepal Length = 6.2<br />Sepal Width = 2.9<br />Row Number: 98","Sepal Length = 5.1<br />Sepal Width = 2.5<br />Row Number: 99","Sepal Length = 5.7<br />Sepal Width = 2.8<br />Row Number: 100","Sepal Length = 6.3<br />Sepal Width = 3.3<br />Row Number: 101","Sepal Length = 5.8<br />Sepal Width = 2.7<br />Row Number: 102","Sepal Length = 7.1<br />Sepal Width = 3<br />Row Number: 103","Sepal Length = 6.3<br />Sepal Width = 2.9<br />Row Number: 104","Sepal Length = 6.5<br />Sepal Width = 3<br />Row Number: 105","Sepal Length = 7.6<br />Sepal Width = 3<br />Row Number: 106","Sepal Length = 4.9<br />Sepal Width = 2.5<br />Row Number: 107","Sepal Length = 7.3<br />Sepal Width = 2.9<br />Row Number: 108","Sepal Length = 6.7<br />Sepal Width = 2.5<br />Row Number: 109","Sepal Length = 7.2<br />Sepal Width = 3.6<br />Row Number: 110","Sepal Length = 6.5<br />Sepal Width = 3.2<br />Row Number: 111","Sepal Length = 6.4<br />Sepal Width = 2.7<br />Row Number: 112","Sepal Length = 6.8<br />Sepal Width = 3<br />Row Number: 113","Sepal Length = 5.7<br />Sepal Width = 2.5<br />Row Number: 114","Sepal Length = 5.8<br />Sepal Width = 2.8<br />Row Number: 115","Sepal Length = 6.4<br />Sepal Width = 3.2<br />Row Number: 116","Sepal Length = 6.5<br />Sepal Width = 3<br />Row Number: 117","Sepal Length = 7.7<br />Sepal Width = 3.8<br />Row Number: 118","Sepal Length = 7.7<br />Sepal Width = 2.6<br />Row Number: 119","Sepal Length = 6<br />Sepal Width = 2.2<br />Row Number: 120","Sepal Length = 6.9<br />Sepal Width = 3.2<br />Row Number: 121","Sepal Length = 5.6<br />Sepal Width = 2.8<br />Row Number: 122","Sepal Length = 7.7<br />Sepal Width = 2.8<br />Row Number: 123","Sepal Length = 6.3<br />Sepal Width = 2.7<br />Row Number: 124","Sepal Length = 6.7<br />Sepal Width = 3.3<br />Row Number: 125","Sepal Length = 7.2<br />Sepal Width = 3.2<br />Row Number: 126","Sepal Length = 6.2<br />Sepal Width = 2.8<br />Row Number: 127","Sepal Length = 6.1<br />Sepal Width = 3<br />Row Number: 128","Sepal Length = 6.4<br />Sepal Width = 2.8<br />Row Number: 129","Sepal Length = 7.2<br />Sepal Width = 3<br />Row Number: 130","Sepal Length = 7.4<br />Sepal Width = 2.8<br />Row Number: 131","Sepal Length = 7.9<br />Sepal Width = 3.8<br />Row Number: 132","Sepal Length = 6.4<br />Sepal Width = 2.8<br />Row Number: 133","Sepal Length = 6.3<br />Sepal Width = 2.8<br />Row Number: 134","Sepal Length = 6.1<br />Sepal Width = 2.6<br />Row Number: 135","Sepal Length = 7.7<br />Sepal Width = 3<br />Row Number: 136","Sepal Length = 6.3<br />Sepal Width = 3.4<br />Row Number: 137","Sepal Length = 6.4<br />Sepal Width = 3.1<br />Row Number: 138","Sepal Length = 6<br />Sepal Width = 3<br />Row Number: 139","Sepal Length = 6.9<br />Sepal Width = 3.1<br />Row Number: 140","Sepal Length = 6.7<br />Sepal Width = 3.1<br />Row Number: 141","Sepal Length = 6.9<br />Sepal Width = 3.1<br />Row Number: 142","Sepal Length = 5.8<br />Sepal Width = 2.7<br />Row Number: 143","Sepal Length = 6.8<br />Sepal Width = 3.2<br />Row Number: 144","Sepal Length = 6.7<br />Sepal Width = 3.3<br />Row Number: 145","Sepal Length = 6.7<br />Sepal Width = 3<br />Row Number: 146","Sepal Length = 6.3<br />Sepal Width = 2.5<br />Row Number: 147","Sepal Length = 6.5<br />Sepal Width = 3<br />Row Number: 148","Sepal Length = 6.2<br />Sepal Width = 3.4<br />Row Number: 149","Sepal Length = 5.9<br />Sepal Width = 3<br />Row Number: 150"],"type":"scatter","mode":"markers","marker":{"autocolorscale":false,"color":"rgba(0,186,56,1)","opacity":0.6,"size":7.55905511811024,"symbol":"triangle-up","line":{"width":1.88976377952756,"color":"rgba(0,186,56,1)"}},"hoveron":"points","name":"versicolor","legendgroup":"versicolor","showlegend":true,"xaxis":"x","yaxis":"y","hoverinfo":"text","frame":null},{"x":[6.3,5.8,7.1,6.3,6.5,7.6,4.9,7.3,6.7,7.2,6.5,6.4,6.8,5.7,5.8,6.4,6.5,7.7,7.7,6,6.9,5.6,7.7,6.3,6.7,7.2,6.2,6.1,6.4,7.2,7.4,7.9,6.4,6.3,6.1,7.7,6.3,6.4,6,6.9,6.7,6.9,5.8,6.8,6.7,6.7,6.3,6.5,6.2,5.9],"y":[3.3,2.7,3,2.9,3,3,2.5,2.9,2.5,3.6,3.2,2.7,3,2.5,2.8,3.2,3,3.8,2.6,2.2,3.2,2.8,2.8,2.7,3.3,3.2,2.8,3,2.8,3,2.8,3.8,2.8,2.8,2.6,3,3.4,3.1,3,3.1,3.1,3.1,2.7,3.2,3.3,3,2.5,3,3.4,3],"text":["Sepal Length = 5.1<br />Sepal Width = 3.5<br />Row Number: 1","Sepal Length = 4.9<br />Sepal Width = 3<br />Row Number: 2","Sepal Length = 4.7<br />Sepal Width = 3.2<br />Row Number: 3","Sepal Length = 4.6<br />Sepal Width = 3.1<br />Row Number: 4","Sepal Length = 5<br />Sepal Width = 3.6<br />Row Number: 5","Sepal Length = 5.4<br />Sepal Width = 3.9<br />Row Number: 6","Sepal Length = 4.6<br />Sepal Width = 3.4<br />Row Number: 7","Sepal Length = 5<br />Sepal Width = 3.4<br />Row Number: 8","Sepal Length = 4.4<br />Sepal Width = 2.9<br />Row Number: 9","Sepal Length = 4.9<br />Sepal Width = 3.1<br />Row Number: 10","Sepal Length = 5.4<br />Sepal Width = 3.7<br />Row Number: 11","Sepal Length = 4.8<br />Sepal Width = 3.4<br />Row Number: 12","Sepal Length = 4.8<br />Sepal Width = 3<br />Row Number: 13","Sepal Length = 4.3<br />Sepal Width = 3<br />Row Number: 14","Sepal Length = 5.8<br />Sepal Width = 4<br />Row Number: 15","Sepal Length = 5.7<br />Sepal Width = 4.4<br />Row Number: 16","Sepal Length = 5.4<br />Sepal Width = 3.9<br />Row Number: 17","Sepal Length = 5.1<br />Sepal Width = 3.5<br />Row Number: 18","Sepal Length = 5.7<br />Sepal Width = 3.8<br />Row Number: 19","Sepal Length = 5.1<br />Sepal Width = 3.8<br />Row Number: 20","Sepal Length = 5.4<br />Sepal Width = 3.4<br />Row Number: 21","Sepal Length = 5.1<br />Sepal Width = 3.7<br />Row Number: 22","Sepal Length = 4.6<br />Sepal Width = 3.6<br />Row Number: 23","Sepal Length = 5.1<br />Sepal Width = 3.3<br />Row Number: 24","Sepal Length = 4.8<br />Sepal Width = 3.4<br />Row Number: 25","Sepal Length = 5<br />Sepal Width = 3<br />Row Number: 26","Sepal Length = 5<br />Sepal Width = 3.4<br />Row Number: 27","Sepal Length = 5.2<br />Sepal Width = 3.5<br />Row Number: 28","Sepal Length = 5.2<br />Sepal Width = 3.4<br />Row Number: 29","Sepal Length = 4.7<br />Sepal Width = 3.2<br />Row Number: 30","Sepal Length = 4.8<br />Sepal Width = 3.1<br />Row Number: 31","Sepal Length = 5.4<br />Sepal Width = 3.4<br />Row Number: 32","Sepal Length = 5.2<br />Sepal Width = 4.1<br />Row Number: 33","Sepal Length = 5.5<br />Sepal Width = 4.2<br />Row Number: 34","Sepal Length = 4.9<br />Sepal Width = 3.1<br />Row Number: 35","Sepal Length = 5<br />Sepal Width = 3.2<br />Row Number: 36","Sepal Length = 5.5<br />Sepal Width = 3.5<br />Row Number: 37","Sepal Length = 4.9<br />Sepal Width = 3.6<br />Row Number: 38","Sepal Length = 4.4<br />Sepal Width = 3<br />Row Number: 39","Sepal Length = 5.1<br />Sepal Width = 3.4<br />Row Number: 40","Sepal Length = 5<br />Sepal Width = 3.5<br />Row Number: 41","Sepal Length = 4.5<br />Sepal Width = 2.3<br />Row Number: 42","Sepal Length = 4.4<br />Sepal Width = 3.2<br />Row Number: 43","Sepal Length = 5<br />Sepal Width = 3.5<br />Row Number: 44","Sepal Length = 5.1<br />Sepal Width = 3.8<br />Row Number: 45","Sepal Length = 4.8<br />Sepal Width = 3<br />Row Number: 46","Sepal Length = 5.1<br />Sepal Width = 3.8<br />Row Number: 47","Sepal Length = 4.6<br />Sepal Width = 3.2<br />Row Number: 48","Sepal Length = 5.3<br />Sepal Width = 3.7<br />Row Number: 49","Sepal Length = 5<br />Sepal Width = 3.3<br />Row Number: 50","Sepal Length = 7<br />Sepal Width = 3.2<br />Row Number: 51","Sepal Length = 6.4<br />Sepal Width = 3.2<br />Row Number: 52","Sepal Length = 6.9<br />Sepal Width = 3.1<br />Row Number: 53","Sepal Length = 5.5<br />Sepal Width = 2.3<br />Row Number: 54","Sepal Length = 6.5<br />Sepal Width = 2.8<br />Row Number: 55","Sepal Length = 5.7<br />Sepal Width = 2.8<br />Row Number: 56","Sepal Length = 6.3<br />Sepal Width = 3.3<br />Row Number: 57","Sepal Length = 4.9<br />Sepal Width = 2.4<br />Row Number: 58","Sepal Length = 6.6<br />Sepal Width = 2.9<br />Row Number: 59","Sepal Length = 5.2<br />Sepal Width = 2.7<br />Row Number: 60","Sepal Length = 5<br />Sepal Width = 2<br />Row Number: 61","Sepal Length = 5.9<br />Sepal Width = 3<br />Row Number: 62","Sepal Length = 6<br />Sepal Width = 2.2<br />Row Number: 63","Sepal Length = 6.1<br />Sepal Width = 2.9<br />Row Number: 64","Sepal Length = 5.6<br />Sepal Width = 2.9<br />Row Number: 65","Sepal Length = 6.7<br />Sepal Width = 3.1<br />Row Number: 66","Sepal Length = 5.6<br />Sepal Width = 3<br />Row Number: 67","Sepal Length = 5.8<br />Sepal Width = 2.7<br />Row Number: 68","Sepal Length = 6.2<br />Sepal Width = 2.2<br />Row Number: 69","Sepal Length = 5.6<br />Sepal Width = 2.5<br />Row Number: 70","Sepal Length = 5.9<br />Sepal Width = 3.2<br />Row Number: 71","Sepal Length = 6.1<br />Sepal Width = 2.8<br />Row Number: 72","Sepal Length = 6.3<br />Sepal Width = 2.5<br />Row Number: 73","Sepal Length = 6.1<br />Sepal Width = 2.8<br />Row Number: 74","Sepal Length = 6.4<br />Sepal Width = 2.9<br />Row Number: 75","Sepal Length = 6.6<br />Sepal Width = 3<br />Row Number: 76","Sepal Length = 6.8<br />Sepal Width = 2.8<br />Row Number: 77","Sepal Length = 6.7<br />Sepal Width = 3<br />Row Number: 78","Sepal Length = 6<br />Sepal Width = 2.9<br />Row Number: 79","Sepal Length = 5.7<br />Sepal Width = 2.6<br />Row Number: 80","Sepal Length = 5.5<br />Sepal Width = 2.4<br />Row Number: 81","Sepal Length = 5.5<br />Sepal Width = 2.4<br />Row Number: 82","Sepal Length = 5.8<br />Sepal Width = 2.7<br />Row Number: 83","Sepal Length = 6<br />Sepal Width = 2.7<br />Row Number: 84","Sepal Length = 5.4<br />Sepal Width = 3<br />Row Number: 85","Sepal Length = 6<br />Sepal Width = 3.4<br />Row Number: 86","Sepal Length = 6.7<br />Sepal Width = 3.1<br />Row Number: 87","Sepal Length = 6.3<br />Sepal Width = 2.3<br />Row Number: 88","Sepal Length = 5.6<br />Sepal Width = 3<br />Row Number: 89","Sepal Length = 5.5<br />Sepal Width = 2.5<br />Row Number: 90","Sepal Length = 5.5<br />Sepal Width = 2.6<br />Row Number: 91","Sepal Length = 6.1<br />Sepal Width = 3<br />Row Number: 92","Sepal Length = 5.8<br />Sepal Width = 2.6<br />Row Number: 93","Sepal Length = 5<br />Sepal Width = 2.3<br />Row Number: 94","Sepal Length = 5.6<br />Sepal Width = 2.7<br />Row Number: 95","Sepal Length = 5.7<br />Sepal Width = 3<br />Row Number: 96","Sepal Length = 5.7<br />Sepal Width = 2.9<br />Row Number: 97","Sepal Length = 6.2<br />Sepal Width = 2.9<br />Row Number: 98","Sepal Length = 5.1<br />Sepal Width = 2.5<br />Row Number: 99","Sepal Length = 5.7<br />Sepal Width = 2.8<br />Row Number: 100","Sepal Length = 6.3<br />Sepal Width = 3.3<br />Row Number: 101","Sepal Length = 5.8<br />Sepal Width = 2.7<br />Row Number: 102","Sepal Length = 7.1<br />Sepal Width = 3<br />Row Number: 103","Sepal Length = 6.3<br />Sepal Width = 2.9<br />Row Number: 104","Sepal Length = 6.5<br />Sepal Width = 3<br />Row Number: 105","Sepal Length = 7.6<br />Sepal Width = 3<br />Row Number: 106","Sepal Length = 4.9<br />Sepal Width = 2.5<br />Row Number: 107","Sepal Length = 7.3<br />Sepal Width = 2.9<br />Row Number: 108","Sepal Length = 6.7<br />Sepal Width = 2.5<br />Row Number: 109","Sepal Length = 7.2<br />Sepal Width = 3.6<br />Row Number: 110","Sepal Length = 6.5<br />Sepal Width = 3.2<br />Row Number: 111","Sepal Length = 6.4<br />Sepal Width = 2.7<br />Row Number: 112","Sepal Length = 6.8<br />Sepal Width = 3<br />Row Number: 113","Sepal Length = 5.7<br />Sepal Width = 2.5<br />Row Number: 114","Sepal Length = 5.8<br />Sepal Width = 2.8<br />Row Number: 115","Sepal Length = 6.4<br />Sepal Width = 3.2<br />Row Number: 116","Sepal Length = 6.5<br />Sepal Width = 3<br />Row Number: 117","Sepal Length = 7.7<br />Sepal Width = 3.8<br />Row Number: 118","Sepal Length = 7.7<br />Sepal Width = 2.6<br />Row Number: 119","Sepal Length = 6<br />Sepal Width = 2.2<br />Row Number: 120","Sepal Length = 6.9<br />Sepal Width = 3.2<br />Row Number: 121","Sepal Length = 5.6<br />Sepal Width = 2.8<br />Row Number: 122","Sepal Length = 7.7<br />Sepal Width = 2.8<br />Row Number: 123","Sepal Length = 6.3<br />Sepal Width = 2.7<br />Row Number: 124","Sepal Length = 6.7<br />Sepal Width = 3.3<br />Row Number: 125","Sepal Length = 7.2<br />Sepal Width = 3.2<br />Row Number: 126","Sepal Length = 6.2<br />Sepal Width = 2.8<br />Row Number: 127","Sepal Length = 6.1<br />Sepal Width = 3<br />Row Number: 128","Sepal Length = 6.4<br />Sepal Width = 2.8<br />Row Number: 129","Sepal Length = 7.2<br />Sepal Width = 3<br />Row Number: 130","Sepal Length = 7.4<br />Sepal Width = 2.8<br />Row Number: 131","Sepal Length = 7.9<br />Sepal Width = 3.8<br />Row Number: 132","Sepal Length = 6.4<br />Sepal Width = 2.8<br />Row Number: 133","Sepal Length = 6.3<br />Sepal Width = 2.8<br />Row Number: 134","Sepal Length = 6.1<br />Sepal Width = 2.6<br />Row Number: 135","Sepal Length = 7.7<br />Sepal Width = 3<br />Row Number: 136","Sepal Length = 6.3<br />Sepal Width = 3.4<br />Row Number: 137","Sepal Length = 6.4<br />Sepal Width = 3.1<br />Row Number: 138","Sepal Length = 6<br />Sepal Width = 3<br />Row Number: 139","Sepal Length = 6.9<br />Sepal Width = 3.1<br />Row Number: 140","Sepal Length = 6.7<br />Sepal Width = 3.1<br />Row Number: 141","Sepal Length = 6.9<br />Sepal Width = 3.1<br />Row Number: 142","Sepal Length = 5.8<br />Sepal Width = 2.7<br />Row Number: 143","Sepal Length = 6.8<br />Sepal Width = 3.2<br />Row Number: 144","Sepal Length = 6.7<br />Sepal Width = 3.3<br />Row Number: 145","Sepal Length = 6.7<br />Sepal Width = 3<br />Row Number: 146","Sepal Length = 6.3<br />Sepal Width = 2.5<br />Row Number: 147","Sepal Length = 6.5<br />Sepal Width = 3<br />Row Number: 148","Sepal Length = 6.2<br />Sepal Width = 3.4<br />Row Number: 149","Sepal Length = 5.9<br />Sepal Width = 3<br />Row Number: 150"],"type":"scatter","mode":"markers","marker":{"autocolorscale":false,"color":"rgba(97,156,255,1)","opacity":0.6,"size":7.55905511811024,"symbol":"square","line":{"width":1.88976377952756,"color":"rgba(97,156,255,1)"}},"hoveron":"points","name":"virginica","legendgroup":"virginica","showlegend":true,"xaxis":"x","yaxis":"y","hoverinfo":"text","frame":null}],"layout":{"margin":{"t":23.3059360730594,"r":7.30593607305936,"b":37.2602739726027,"l":43.1050228310502},"plot_bgcolor":"rgba(255,255,255,1)","paper_bgcolor":"rgba(255,255,255,1)","font":{"color":"rgba(0,0,0,1)","family":"","size":14.6118721461187},"xaxis":{"domain":[0,1],"automargin":true,"type":"linear","autorange":false,"range":[4.12,8.08],"tickmode":"array","ticktext":["5","6","7","8"],"tickvals":[5,6,7,8],"categoryorder":"array","categoryarray":["5","6","7","8"],"nticks":null,"ticks":"outside","tickcolor":"rgba(51,51,51,1)","ticklen":3.65296803652968,"tickwidth":0.66417600664176,"showticklabels":true,"tickfont":{"color":"rgba(77,77,77,1)","family":"","size":11.689497716895},"tickangle":-0,"showline":false,"linecolor":null,"linewidth":0,"showgrid":true,"gridcolor":"rgba(235,235,235,1)","gridwidth":0.66417600664176,"zeroline":false,"anchor":"y","title":{"text":"Sepal.Length","font":{"color":"rgba(0,0,0,1)","family":"","size":14.6118721461187}},"hoverformat":".2f"},"yaxis":{"domain":[0,1],"automargin":true,"type":"linear","autorange":false,"range":[1.88,4.52],"tickmode":"array","ticktext":["2.0","2.5","3.0","3.5","4.0","4.5"],"tickvals":[2,2.5,3,3.5,4,4.5],"categoryorder":"array","categoryarray":["2.0","2.5","3.0","3.5","4.0","4.5"],"nticks":null,"ticks":"outside","tickcolor":"rgba(51,51,51,1)","ticklen":3.65296803652968,"tickwidth":0.66417600664176,"showticklabels":true,"tickfont":{"color":"rgba(77,77,77,1)","family":"","size":11.689497716895},"tickangle":-0,"showline":false,"linecolor":null,"linewidth":0,"showgrid":true,"gridcolor":"rgba(235,235,235,1)","gridwidth":0.66417600664176,"zeroline":false,"anchor":"x","title":{"text":"Sepal.Width","font":{"color":"rgba(0,0,0,1)","family":"","size":14.6118721461187}},"hoverformat":".2f"},"shapes":[{"type":"rect","fillcolor":"transparent","line":{"color":"rgba(51,51,51,1)","width":0.66417600664176,"linetype":"solid"},"yref":"paper","xref":"paper","x0":0,"x1":1,"y0":0,"y1":1}],"showlegend":true,"legend":{"bgcolor":"rgba(255,255,255,1)","bordercolor":"transparent","borderwidth":1.88976377952756,"font":{"color":"rgba(0,0,0,1)","family":"","size":11.689497716895},"y":0.938132733408324},"annotations":[{"text":"Species","x":1.02,"y":1,"showarrow":false,"ax":0,"ay":0,"font":{"color":"rgba(0,0,0,1)","family":"","size":14.6118721461187},"xref":"paper","yref":"paper","textangle":-0,"xanchor":"left","yanchor":"bottom","legendTitle":true}],"hovermode":"closest","barmode":"relative"},"config":{"doubleClick":"reset","showSendToCloud":false},"source":"A","attrs":{"181c33dca8335":{"x":{},"y":{},"colour":{},"shape":{},"type":"scatter"}},"cur_data":"181c33dca8335","visdat":{"181c33dca8335":["function (y) ","x"]},"highlight":{"on":"plotly_click","persistent":false,"dynamic":false,"selectize":false,"opacityDim":0.2,"selected":{"opacity":1},"debounce":0},"shinyEvents":["plotly_hover","plotly_click","plotly_selected","plotly_relayout","plotly_brushed","plotly_brushing","plotly_clickannotation","plotly_doubleclick","plotly_deselect","plotly_afterplot","plotly_sunburstclick"],"base_url":"https://plot.ly"},"evals":[],"jsHooks":[]}</script> <!---<iframe src="why_plot_files/pl.html" width="1200" height="500" scrolling="yes" seamless="seamless" frameBorder="0"> </iframe> ---> ??? These graphs are clickable. For example, click on a symbol on the legend, or drag your mouse over a region with left button held down. --- ## Network graphs <iframe src="anim/fn.html" width="1200" height="500" scrolling="no" seamless="seamless" frameBorder="0"> </iframe> --- ## Animated graphs  --- layout: true <div class="my-header"> <span>BIOF 339: Practical R</span> </div> --- class: middle, center, inverse # For more in-depth looks at data viz, consider BIOF 439 in the Spring